Story Visualizations Released
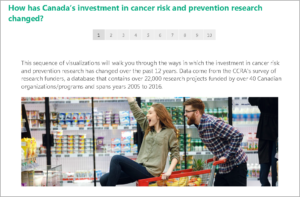 As companions to our 2016 special topic reports, CCRA has released interactive ‘story visualizations’ using Tableau software. Story visualizations are dashboards that are linked sequentially. They walk users through a series of analyses, each with greater detail, and allowing users more opportunity to ‘interact’ with the data. We welcome your feedback!
To access these tools, click here.
Canadian Strategy for Cancer Control (2019-2029)
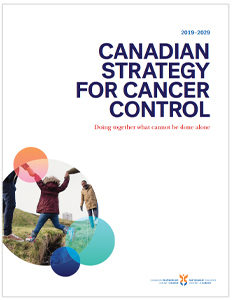 The refreshed Canadian Strategy for Cancer Control is here. Based on input from more than 7,500 Canadians including healthcare leaders from across the country, the Strategy sets the course for a more equitable approach to cancer in Canada. No matter who we are or where we live, we should all have access to world-class ... Read More »
The refreshed Canadian Strategy for Cancer Control is here. Based on input from more than 7,500 Canadians including healthcare leaders from across the country, the Strategy sets the course for a more equitable approach to cancer in Canada. No matter who we are or where we live, we should all have access to world-class ... Read More »
Call for Operating Grant Proposals from LLSC
 Canadian researchers are invited to submit proposals to The Leukemia & Lymphoma Society of Canada’s (LLSC) Operating Grant program for research aimed at preventing, detecting and treating all types of blood cancers. The application process consists of two phases. The first phase is submission and consideration of a Lette... Read More »
Canadian researchers are invited to submit proposals to The Leukemia & Lymphoma Society of Canada’s (LLSC) Operating Grant program for research aimed at preventing, detecting and treating all types of blood cancers. The application process consists of two phases. The first phase is submission and consideration of a Lette... Read More »